
Search for Indicators
Healthy Pima Progress Tracker
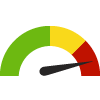
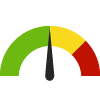
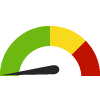
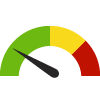
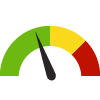
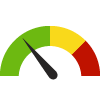
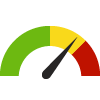
Indicator Gauge Icon Legend
Legend Colors
Red is bad, green is good, blue is not statistically different/neutral.
Compared to Distribution
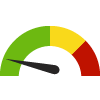 the value is in the best half of communities.
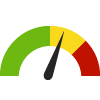 the value is in the 2nd worst quarter of communities.
 the value is in the worst quarter of communities.
Compared to Target
 meets target;
  does not meet target.
Compared to a Single Value
 lower than the comparison value;
 higher than the comparison value;
 not statistically different from comparison value.
Trend

 non-significant change over time;
 significant change over time;
  no change over time.
Compared to Prior Value
 higher than the previous measurement period;
 lower than the previous measurement period;
 no statistically different change from previous measurement period.
Mental Health & Substance Misuse
Poor Mental Health: 14+ Days County: Pima
Poor Mental Health: 14+ Days County: Pima
16.2%
(2021)
Compared to:

AZ Counties
The distribution is based on data from 15 Arizona counties.
U.S. Counties
The distribution is based on data from 3,074 U.S. counties and county equivalents.
US Value
(14.7%)
The regional value is compared to the national value.
Mental Health Provider Rate County: Pima
Mental Health Provider Rate County: Pima
229
Providers per 100,000 population
(2023)
Compared to:
AZ Counties
(2021)
The distribution is based on data from 15 Arizona counties.
U.S. Counties
The distribution is based on data from 2,956 U.S. counties and county equivalents.
AZ Value
(182)
The regional value is compared to the Arizona State value.
Prior Value
(216)
Prior Value compares a measured value with the previously measured value. Confidence intervals were not taken into account in determining the direction of the comparison.
Trend
This comparison measures the indicator’s values over multiple time periods.<br>The Mann-Kendall Test for Statistical Significance is used to evaluate the trend<br>over 4 to 10 periods of measure, subject to data availability and comparability.
Adults who Drink Excessively County: Pima
Adults who Drink Excessively County: Pima
17.7%
(2021)
Compared to:
AZ Counties
The distribution is based on data from 15 Arizona counties.
U.S. Counties
The distribution is based on data from 3,141 U.S. counties and county equivalents.
AZ Value
(18.8%)
The regional value is compared to the Arizona State value.
US Value
(18.1%)
The regional value is compared to the national value.
Prior Value
(18.5%)
Prior Value compares a measured value with the previously measured value. Confidence intervals were taken into account in determining the direction of the comparison.
Trend
This comparison measures the indicator’s values over multiple time periods.<br>The Mann-Kendall Test for Statistical Significance is used to evaluate the trend<br>over 4 to 10 periods of measure, subject to data availability and comparability.
Alcohol-Impaired Driving Deaths County: Pima
Alcohol-Impaired Driving Deaths County: Pima
25.0%
Percent of driving deaths with alcohol involvement
(2017-2021)
Compared to:
AZ Counties
The distribution is based on data from 15 Arizona counties.
U.S. Counties
The distribution is based on data from 3,116 U.S. counties and county equivalents.
AZ Value
(21.2%)
The regional value is compared to the Arizona State value.
US Value
(26.3%)
The regional value is compared to the national value.
Prior Value
(25.0%)
Prior Value compares a measured value with the previously measured value. Confidence intervals were taken into account in determining the direction of the comparison.
Trend
This comparison measures the indicator’s values over multiple time periods.<br>The Mann-Kendall Test for Statistical Significance is used to evaluate the trend<br>over 4 to 10 periods of measure, subject to data availability and comparability.
Teens who have Smoked County: Pima
Teens who have Smoked County: Pima
6.0%
(2022)
Compared to:
AZ Counties
(2018)
The distribution is based on data from 15 Arizona counties.
AZ Value
(5.8%)
The regional value is compared to the Arizona State value.
Prior Value
(12.8%)
Prior Value compares a measured value with the previously measured value. Confidence intervals were not taken into account in determining the direction of the comparison.
Trend
This comparison measures the indicator’s values over multiple time periods.<br>The Mann-Kendall Test for Statistical Significance is used to evaluate the trend<br>over 4 to 10 periods of measure, subject to data availability and comparability.
Teens who have Used Methamphetamines County: Pima
Teens who have Used Methamphetamines County: Pima
0.7%
(2022)
Compared to:
AZ Counties
(2018)
The distribution is based on data from 15 Arizona counties.
AZ Value
(0.6%)
The regional value is compared to the Arizona State value.
Prior Value
(0.7%)
Prior Value compares a measured value with the previously measured value. Confidence intervals were not taken into account in determining the direction of the comparison.
Trend
This comparison measures the indicator’s values over multiple time periods.<br>The Mann-Kendall Test for Statistical Significance is used to evaluate the trend<br>over 4 to 10 periods of measure, subject to data availability and comparability.
Teens who Use Alcohol County: Pima
Teens who Use Alcohol County: Pima
14.3%
(2022)
Compared to:
AZ Counties
(2018)
The distribution is based on data from 15 Arizona counties.
AZ Value
(13.5%)
The regional value is compared to the Arizona State value.
Prior Value
(18.7%)
Prior Value compares a measured value with the previously measured value. Confidence intervals were not taken into account in determining the direction of the comparison.
Trend
This comparison measures the indicator’s values over multiple time periods.<br>The Mann-Kendall Test for Statistical Significance is used to evaluate the trend<br>over 4 to 10 periods of measure, subject to data availability and comparability.
Teens who Use Marijuana County: Pima
Teens who Use Marijuana County: Pima
10.4%
(2022)
Compared to:
AZ Counties
(2018)
The distribution is based on data from 15 Arizona counties.
AZ Value
(10.0%)
The regional value is compared to the Arizona State value.
Prior Value
(15.7%)
Prior Value compares a measured value with the previously measured value. Confidence intervals were not taken into account in determining the direction of the comparison.
Trend
This comparison measures the indicator’s values over multiple time periods.<br>The Mann-Kendall Test for Statistical Significance is used to evaluate the trend<br>over 4 to 10 periods of measure, subject to data availability and comparability.
Active Living & Nutrition
Access to Exercise Opportunities County: Pima
Access to Exercise Opportunities County: Pima
85.6%
(2024)
Compared to:

AZ Counties
The distribution is based on data from 15 Arizona counties.
U.S. Counties
The distribution is based on data from 3,096 U.S. counties and county equivalents.
AZ Value
(85.5%)
The regional value is compared to the Arizona State value.
US Value
(84.1%)
The regional value is compared to the national value.
Prior Value
(87.3%)
Prior Value compares a measured value with the previously measured value. Confidence intervals were not taken into account in determining the direction of the comparison.
Poor Physical Health: 14+ Days County: Pima
Poor Physical Health: 14+ Days County: Pima
12.1%
(2021)
Compared to:
AZ Counties
The distribution is based on data from 15 Arizona counties.
U.S. Counties
The distribution is based on data from 3,074 U.S. counties and county equivalents.
US Value
(10.9%)
The regional value is compared to the national value.
Diabetic Monitoring: Medicare Population County: Pima
Diabetic Monitoring: Medicare Population County: Pima
86.0%
(2019)
Compared to:

AZ Counties
The distribution is based on data from 15 Arizona counties.
U.S. Counties
The distribution is based on data from 3,097 U.S. counties and county equivalents.
AZ Value
(82.5%)
The regional value is compared to the Arizona State value.
US Value
(87.5%)
The regional value is compared to the national value.
Prior Value
(85.8%)
Prior Value compares a measured value with the previously measured value. Confidence intervals were taken into account in determining the direction of the comparison.
Trend
This comparison measures the indicator’s values over multiple time periods.<br>The Mann-Kendall Test for Statistical Significance is used to evaluate the trend<br>over 4 to 10 periods of measure, subject to data availability and comparability.
Physical Environment Ranking County: Pima
Physical Environment Ranking County: Pima
5
(2023)
Compared to:
AZ Counties
The distribution is based on data from 15 Arizona counties.
Accidents & Injuries
Age-Adjusted Death Rate due to Falls County: Pima
Age-Adjusted Death Rate due to Falls County: Pima
11.8
Deaths per 100,000 population
(2021)
Compared to:
AZ Counties
(2019)
The distribution is based on data from 15 Arizona counties.
AZ Value
(12.0)
The regional value is compared to the Arizona State value.
US Value
(10.3 in 2020)
The regional value is compared to the national value. The source for the national value is Centers for Disease Control and Prevention
Prior Value
(15.0)
Prior Value compares a measured value with the previously measured value. Confidence intervals were not taken into account in determining the direction of the comparison.
Trend
This comparison measures the indicator’s values over multiple time periods.<br>The Mann-Kendall Test for Statistical Significance is used to evaluate the trend<br>over 4 to 10 periods of measure, subject to data availability and comparability.
Age-Adjusted Death Rate due to Motor Vehicle Collisions County: Pima
Age-Adjusted Death Rate due to Motor Vehicle Collisions County: Pima
16.8
Deaths per 100,000 population
(2021)
Compared to:


AZ Counties
The distribution is based on data from 15 Arizona counties.
AZ Value
(18.4)
The regional value is compared to the Arizona State value.
Prior Value
(15.6)
Prior Value compares a measured value with the previously measured value. Confidence intervals were not taken into account in determining the direction of the comparison.
Trend
This comparison measures the indicator’s values over multiple time periods.<br>The Mann-Kendall Test for Statistical Significance is used to evaluate the trend<br>over 4 to 10 periods of measure, subject to data availability and comparability.
Age-Adjusted Death Rate due to Pedestrian Collisions County: Pima
Age-Adjusted Death Rate due to Pedestrian Collisions County: Pima
3.6
Deaths per 100,000 population
(2016-2020)
Compared to:
AZ Value
(3.1)
The regional value is compared to the Arizona State value.
US Value
(1.9)
The regional value is compared to the national value.
Prior Value
(3.0)
Prior Value compares a measured value with the previously measured value. Confidence intervals were taken into account in determining the direction of the comparison.
Trend
This comparison measures the indicator’s values over multiple time periods.<br>The Mann-Kendall Test for Statistical Significance is used to evaluate the trend<br>over 4 to 10 periods of measure, subject to data availability and comparability.
Age-Adjusted Death Rate due to Firearms County: Pima
Age-Adjusted Death Rate due to Firearms County: Pima
21.7
Deaths per 100,000 population
(2021)
Compared to:
AZ Value
(18.3)
The regional value is compared to the Arizona State value.
Prior Value
(19.4)
Prior Value compares a measured value with the previously measured value. Confidence intervals were not taken into account in determining the direction of the comparison.
Trend
This comparison measures the indicator’s values over multiple time periods.<br>The Mann-Kendall Test for Statistical Significance is used to evaluate the trend<br>over 4 to 10 periods of measure, subject to data availability and comparability.
HP 2030 Target
(10.7)
